6 Best LED Grow Light PAR Meters Serious Growers Rely On
If you’re growing with LED lights, you need accurate PAR meter data to make smart lighting decisions. Without the right meter, you’re guessing at PPFD levels, DLI totals, and spectral output instead of measuring them. Choosing the wrong tool wastes time and hurts your yields. This guide covers six meters that serious growers actually use, breaking down what each one does and why it matters for your setup.
| Quantum PAR Meter Full-Spectrum PPFD Tester for Plants |

| Best Starter Pick | PAR Range: 400–700 nm, 0–5000 μmol/m²/s | Data Logging: Stores up to 100 measurements; real-time display of last 4 readings | Form Factor: Handheld, 7.48 x 3.7 x 1.85 in, 8.4 oz | VIEW LATEST PRICE | Read Our Analysis |
| AH-Quantuv PAR & UVA Meter for Grow Lights |

| Best for Spectrum Analysis | PAR Range: PAR 400–750 nm; also UVA 320–400 nm | Data Logging: Logs up to 100 measurements for light distribution mapping | Form Factor: Handheld, 7.48 x 6.14 x 1.54 in, 6.7 oz | VIEW LATEST PRICE | Read Our Analysis |
| Lightray Mobile Light and PAR Meter with Photone App |

| Best Smartphone Integration | PAR Range: PAR 400–700 nm (ePAR extends into far-red) | Data Logging: DLI tracking over time; no stated fixed record count | Form Factor: Smartphone-based sensor, 3.62 x 2.4 x 1.06 in, 0.317 oz | VIEW LATEST PRICE | Read Our Analysis |
| Handheld Digital Light Meter with LCD Screen |
| Budget-Friendly Pick | PAR Range: Lux only (0–200,000 Lux); no PAR/PPFD measurement | Data Logging: MIN/Max readings with data hold; no multi-reading log | Form Factor: Handheld, lightweight and compact (dimensions not specified) | VIEW LATEST PRICE | Read Our Analysis |
| VBR-100 Quantum PAR Meter with Bluetooth App |

| Best for Mapping | PAR Range: 400–700 nm PPFD; RGB breakdown by 400–500/500–600/600–700 nm | Data Logging: Grid PPFD mapping with downloadable data; no stated fixed record count | Form Factor: Compact standalone sensor, 2.87 x 2.87 x 0.81 in, 77.7 g | VIEW LATEST PRICE | Read Our Analysis |
| PHOTOBIO Advanced Quantum PAR Meter for Light Intensity |
| Best Professional Grade | PAR Range: 400–700 nm PAR flux (μmol/m²/s) | Data Logging: Stores up to 99 readings | Form Factor: Handheld main unit with remote sensor, 5.59 x 6.22 x 3.15 in, 1.12 lbs | VIEW LATEST PRICE | Read Our Analysis |
More Details on Our Top Picks
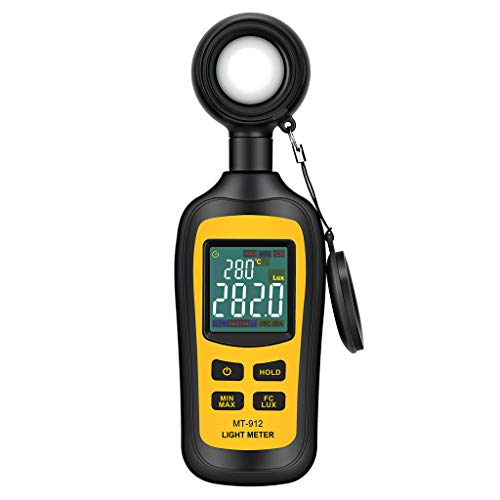
Quantum PAR Meter Full-Spectrum PPFD Tester for Plants
Starting out, it’s a solid starter pick for growers who need reliable PAR readings without a steep learning curve. The DANOPLUS DP-355 measures light in the 400–700 nm range and reads up to 5,000 μmol/m²/s, covering the full photosynthetically active spectrum your plants use. You get real-time readings on the display, and it stores up to 100 values so you can track light levels across different spots. Use the built-in tripod socket to stabilize the meter during measurements. It weighs 8.4 ounces, making it easy to carry between your grow tent, greenhouse, or outdoor field.
- PAR Range:400–700 nm, 0–5000 μmol/m²/s
- Data Logging:Stores up to 100 measurements; real-time display of last 4 readings
- Form Factor:Handheld, 7.48 x 3.7 x 1.85 in, 8.4 oz
- Spectral Breakdown:Single broadband PAR reading; no RGB breakdown
- Connectivity:Standalone; no wireless connectivity
- Power Source:Battery-powered (type not specified)
- Additional Feature:Tripod socket included
- Additional Feature:400–700 nm waveband
- Additional Feature:Real-time last-4 display
AH-Quantuv PAR & UVA Meter for Grow Lights
If spectrum analysis drives your grow-light decisions, the AH-Quantuv PAR & UVA Meter earns its place in your toolkit. It measures PAR across 400–750 nm and UVA across 320–400 nm, then breaks PAR down into blue, green, and red contributions. Use the blue readings during seedling and vegetative stages, then shift focus to red during flowering and fruiting. The HOLD function locks unstable readings, and the recording function stores up to 100 measurements for mapping light distribution across your canopy. It’s CE certified, runs on two included AAA batteries, and weighs just 6.7 ounces.
- PAR Range:PAR 400–750 nm; also UVA 320–400 nm
- Data Logging:Logs up to 100 measurements for light distribution mapping
- Form Factor:Handheld, 7.48 x 6.14 x 1.54 in, 6.7 oz
- Spectral Breakdown:Blue, Green, Red PAR contributions displayed separately
- Connectivity:Standalone; no wireless connectivity stated
- Power Source:2 AAA batteries (included)
- Additional Feature:UVA (320–400 nm) measurement
- Additional Feature:CE certified safety
- Additional Feature:Batteries included (2 AAA)
Lightray Mobile Light and PAR Meter with Photone App
The Lightray PAR Meter pairs seamlessly with smartphone integration through the Photone app. Use it to measure PPFD in μmol/m²/s, DLI in mol/m²/d, and illuminance in lux or foot-candles. It also supports extended PAR, giving you ePPFD and eDLI readings that include far-red light. This matters when running LED setups that emit far-red wavelengths. The device weighs 0.317 ounces and measures 3.62 x 2.4 x 1.06 inches, making it easy to position across your canopy. Built-in guides help beginners interpret readings without guesswork. Lightray released this meter on October 14, 2025.
- PAR Range:PAR 400–700 nm (ePAR extends into far-red)
- Data Logging:DLI tracking over time; no stated fixed record count
- Form Factor:Smartphone-based sensor, 3.62 x 2.4 x 1.06 in, 0.317 oz
- Spectral Breakdown:Standard PAR plus ePAR/ePPFD including far-red
- Connectivity:Smartphone-based via Photone app
- Power Source:Powered by host smartphone
- Additional Feature:Smartphone-based operation
- Additional Feature:DLI measurement included
- Additional Feature:Far-red ePAR support
Handheld Digital Light Meter with LCD Screen
Growers on a tight budget will find this handheld digital light meter a practical, cost-effective option for monitoring grow light output. It measures illuminance from 0 to 200,000 Lux, covering most indoor growing environments. The 4-digit color LCD displays MIN/MAX readings, and the data hold function lets you freeze a reading for recording. Accuracy sits at ±3% below 10,000 Lux and ±4% above it. Use the auto power-off feature to conserve battery life during longer sessions. It’s lightweight, compact, and backed by a 2-year warranty, making it a reliable entry-level tool for tracking light intensity across your grow space.
- PAR Range:Lux only (0–200,000 Lux); no PAR/PPFD measurement
- Data Logging:MIN/Max readings with data hold; no multi-reading log
- Form Factor:Handheld, lightweight and compact (dimensions not specified)
- Spectral Breakdown:Lux only; no spectral breakdown
- Connectivity:Standalone; no wireless connectivity
- Power Source:Battery-powered (type not specified); low battery indicator included
- Additional Feature:Ambient temperature measurement
- Additional Feature:200,000 Lux range
- Additional Feature:2-year warranty
VBR-100 Quantum PAR Meter with Bluetooth App
Most growers needing to map light distribution across their canopy will find the VBR-100 a reliable tool. Connect it via Bluetooth to the free companion app, then walk your grow space and record PPFD readings at multiple grid points. The app organizes those readings into a distribution map, showing you weak zones and uneven coverage. You can also view the RGB spectral breakdown, which separates blue, green, and red PAR values so you can adjust your fixture placement for vegetative or flowering stages. It’s battery-powered, weighs 77.7 grams, and requires no spectrum selection before measuring.
- PAR Range:400–700 nm PPFD; RGB breakdown by 400–500/500–600/600–700 nm
- Data Logging:Grid PPFD mapping with downloadable data; no stated fixed record count
- Form Factor:Compact standalone sensor, 2.87 x 2.87 x 0.81 in, 77.7 g
- Spectral Breakdown:Separate Blue (400–500 nm), Green (500–600 nm), Red (600–700 nm) PAR values
- Connectivity:Bluetooth; free companion app, no subscription
- Power Source:Battery-powered (type not specified)
- Additional Feature:Drone-mountable sensor
- Additional Feature:PPFD uniformity mapping
- Additional Feature:No subscription fees
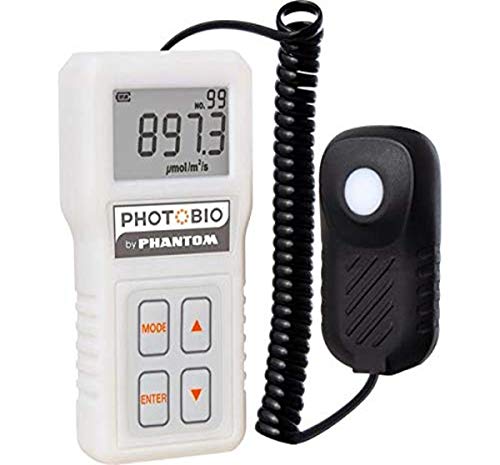
PHOTOBIO Advanced Quantum PAR Meter for Light Intensity
When you need professional-grade precision, PHOTOBIO’s LGBQM2 Advanced Quantum PAR Meter delivers it. It measures PAR light between 400–700 nm, the range directly tied to photosynthesis and crop yield. You’ll get two connection cables—a short coiled one and a 12-foot straight cable—giving you flexibility when positioning the remote sensor. Store up to 99 readings as you adjust light height, dimmer settings, or growth phases. It works with LED, HPS, and traditional grow lights, so you’re not limited to one setup. The handheld unit is compact, battery-powered, and straightforward to operate without a learning curve.
- PAR Range:400–700 nm PAR flux (μmol/m²/s)
- Data Logging:Stores up to 99 readings
- Form Factor:Handheld main unit with remote sensor, 5.59 x 6.22 x 3.15 in, 1.12 lbs
- Spectral Breakdown:Single broadband PAR reading; no RGB breakdown
- Connectivity:Standalone; no wireless connectivity
- Power Source:1 AAA battery required
- Additional Feature:Remote sensor + cables
- Additional Feature:Protective carrying case
- Additional Feature:HPS light compatible
Factors to Consider When Choosing a Led Grow Light Par Meter
Choosing the right PAR meter for your LED grow setup comes down to five key factors: measurement range accuracy, spectral coverage width, data recording capacity, connectivity and compatibility, and portability and build quality. Each factor directly affects how useful and reliable the meter will be in your specific growing environment. Understanding what each factor means and how it applies to your setup will help you make a confident, well-informed purchase.
Measurement Range Accuracy
A PAR meter’s measurement range and accuracy determine whether it’ll give you reliable data across your entire grow setup. Look for a meter that covers 400–700 nm, since that’s the standard photosynthetically active radiation range most plants use. Some meters extend to 750 nm, which adds flexibility for certain crops.
Choose a meter with a reading range of 0–5000 μmol/m²/s so it handles both low-light seedling stages and high-intensity flowering conditions. Check that the accuracy tolerance stays within ±10 nm across the waveband.
If you’re using LED grow lights with distinct color outputs, select a meter that breaks down blue, green, and red PAR components separately. This confirms the sensor reads accurately across each wavelength band your plants actually absorb.
Spectral Coverage Width
How wide a meter’s spectral coverage reaches directly affects how useful its readings are across different lighting setups. Most PAR meters cover 400–700 nm, which captures the full range plants use for photosynthesis. That core range is what you need as a baseline.
Some meters extend into near-UV (320–400 nm) or far-red (beyond 700 nm) territory. These wider ranges give you more context when analyzing LED arrays, HPS fixtures, or natural sunlight together.
Check whether your meter reads full-spectrum 400–700 nm as a single value or splits readings into RGB components like blue, green, and red. RGB breakdowns help you identify spectral imbalances.
If you choose an extended-range meter, confirm it still lists calibration details and tolerance specifically for the core 400–700 nm PAR window.
Data Recording Capacity
Data recording capacity tells you how many measurements a PAR meter can store before you need to offload or overwrite the data. Most models hold between 99 and 100 readings, which works for basic mapping but fills up quickly during large-scale surveys. A higher capacity lets you cover more canopy zones or track longer time periods without stopping to clear the memory. Some meters display your last four readings in real time while still saving a full history, so you can monitor and log simultaneously. When comparing options, check whether the meter timestamps each entry, supports batch downloads via Bluetooth or USB, and allows you to overwrite older records. These features determine how efficiently you can analyze and compare data across multiple fixtures or growth cycles.
Connectivity and Compatibility
Connectivity and compatibility determine how well your PAR meter fits into your existing setup and workflow. First, confirm the meter uses a communication protocol your system supports, such as Bluetooth, USB, or standalone operation, so data transfers without extra steps. Next, check whether the meter pairs with a smartphone app or companion software that displays real-time readings and stores historical trends for easy review. If you’re running mixed lighting, including LED, HPS, or sunlight, verify the meter handles diverse spectra without producing incorrect PAR values. Also, look for models that provide an RGB breakdown showing blue, green, and red PAR levels separately, which helps you match spectrum output to each growth stage. These checks ensure your meter works accurately within your specific environment.
Portability and Build Quality
Portability and build quality affect how easily you can move your PAR meter through a grow space and how long it holds up under regular use. Look for a meter under 9 ounces so you can hold it steady during measurements without fatigue. Check dimensions between 3 and 7 inches in length with a slim profile, which helps you reach tight spots between canopies. Choose a rugged housing that resists drops and frequent handling in humid conditions. Verify the meter includes a built-in tripod mount for hands-free, stable readings. Confirm it runs on standard AAA batteries so replacements stay accessible. A carrying case or protective sleeve keeps the sensor safe between uses and makes transport straightforward during regular grow room inspections.
Display and Interface
Once you’ve confirmed a meter fits comfortably in your hand and holds up to regular use, shift your attention to how it displays data. Look for an LCD or OLED screen that shows current PPFD values in μmol/m²/s in real time. Confirm the display includes multiple modes so you can view PAR, UVA, and RGB breakdowns without digging through complex menus. Check that the screen clearly labels the waveband range, such as 400–700 nm, and uses consistent units throughout. A HOLD function lets you freeze a reading on screen, which helps when you’re documenting measurements across multiple canopy points. Finally, test readability under bright grow lights, since digits that wash out or blur under intense light will slow your workflow considerably.
Power Source Options
How a PAR meter gets its power directly affects where and how long you can use it, so check this spec before you buy. Some meters run on AA or AAA batteries, which you can replace anywhere but may need frequent swapping. Built-in rechargeable batteries reduce ongoing costs, and low-battery indicators help you plan sessions without interruptions. USB-C or micro-USB models recharge from laptops or power banks, making them practical for extended field work. External power adapters suit fixed lab setups where portability isn’t a priority. If you’re mounting a meter on a drone or vehicle, confirm the unit’s power arrangement works with your portable power solution. Match the power source to your specific testing environment before committing to a model.
Final Thoughts
You’ve got six solid PAR meters to choose from, each built for specific needs. If you want Bluetooth mapping, go with the VBR-100. If UVA readings matter, pick the AH-Quantuv. For app-based mobility, the Lightray works well. Match the meter to your setup, check your PPFD targets, and use DLI data to adjust your lighting schedule. The right meter helps you make precise, repeatable decisions that directly improve your crop results.
Related Posts


About The Author
LED Guru
An experienced veteran when it comes to growing indoors, hydroponics, and organics. LED Guru shares a massive amount of knowledge about LED growing and how to do it best.